Value distributed to our stakeholders
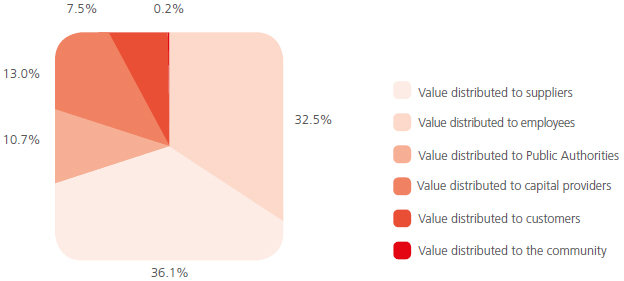
In 2015, SEA Group generated an economic value of 642.4 million Euro, up 3.3% over the previous year. The distributed economic value increased by 9.2% compared to the previous year, going from 499.3 million in 2014 to 545.0 million in 2015. In 2015, 177.0 million Euro were allocated to staff remuneration, equal to 32.5% of the value and to 27.5 % of what was generated. Compared with the previous year, the share of value assigned to the organization’s providers of capital (shareholders and lenders) has increased, both in absolute terms (51.0 million in 2014 and 70.8 million in 2015), and as a share of the total distributed value (respectively 10.2% in 2014 and 13.0% in 2015). In particular, the amounts of dividends (ordinary and extraordinary), which amounted to 26.5 million Euro in 2014, totalled 50.9 million Euro in 2015. The share of value reserved for suppliers of goods and services (restated operating costs) was 196.9 million Euro in 2015 (compared to 188.6 million Euro in 2014) and accounts for 36.1% of the total distributed value. Meanwhile, the share allocated to Public Administration in form of taxes and fees was 58.5 million Euro (10.7% of the distributed value). Finally, the share of distributed value destined for the company and the local area was equal to 0.17% in 2015, corresponding to the sum of donations provided to third sector organizations and associations, supporting cultural, humanitarian, scientific and sporting projects.
Table of economic value generated and distributed by the Group (.000 Euro)
| 2015 | 2014 | ||
|---|---|---|---|
| Economic value generated directly | 642,408 | 621,634 | |
| a) Revenues | Operating revenues | 642,408 | 621,634 |
| Distributed economic value | 545,002 | 499,290 | |
| b) Restated operating costs | Consumable costs and other reclassified operating cost | 196,990 | 188,554 |
| c) Commercial costs | Commercial costs | 40,786 | 43,101 |
| d) Wages and benefits for human resources | Labour costs | 176,979 | 161,501 |
| e) Payments to capital providers | Financial charges and dividends distributed during the year | 70,845 | 51,029 |
| f) Payments to Public Administration | Current incomes taxes and tax charges | 58,500 | 54,340 |
| g) Investments in the community | Donations, sponsorships and collaborations | 902 | 765 |
| Retained economic value | Calculated as the difference between the generated economic value and the distributed economic value | 97,406 | 122,344 |
Economic value distributed in 2015

Source: SEA