Quality of the commercial offer
In 2011, SEA introduced the “Mystery shopping”, a quality-assurance tool for commercial services, based on visits and interviews by incognito personnel, with the aim of gathering structured information on users’ purchasing experiences at its airports. In the shop, the mystery shopper simulates the “typical customer” experience, focusing on:
- style and conduct of the sales personnel;
- level of professional expertise and knowledge;
- problem-solving skills;
- effectiveness in sales, customer retention, and in proposing additional purchases;
- ability to listen, empathy, kindness and congeniality;
- consistency with the corporate philosophy;
- in-store feel.
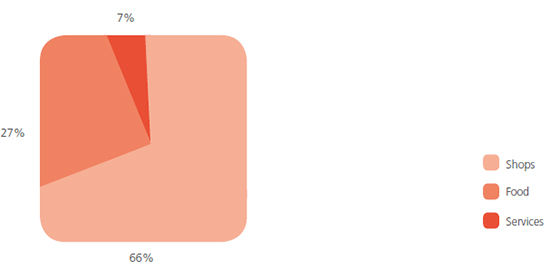
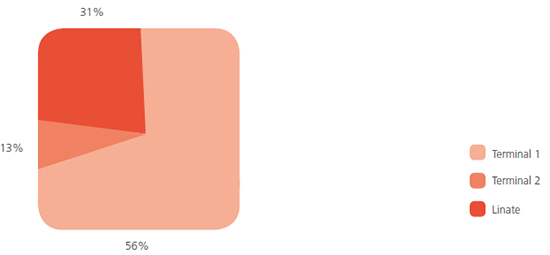
During 2015, 218 businesses were involved in a total of 799 visits, broken down by type of shop and location in the airports.
Mystery Shopping - Visited shops by type of business
Source: SEA
Mystery Shopping - Visited shops by location
Source: SEA
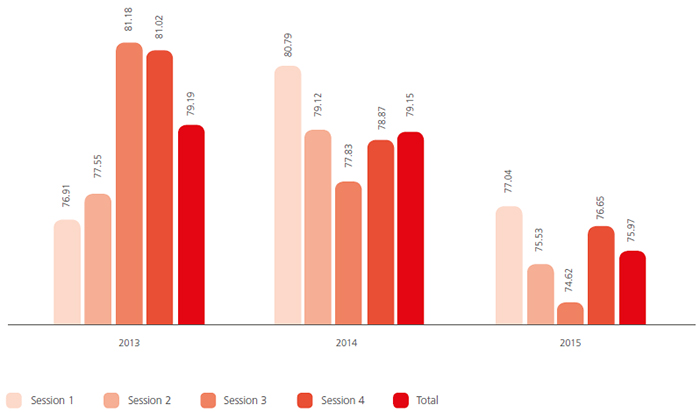
The perceived quality of the businesses at airports operated by SEA in 2015 stood at an average of nearly 76/100, slightly lower than the previous year.
Mystery Shopping - Average perceived quality (scale 1-100)
Source: SEA
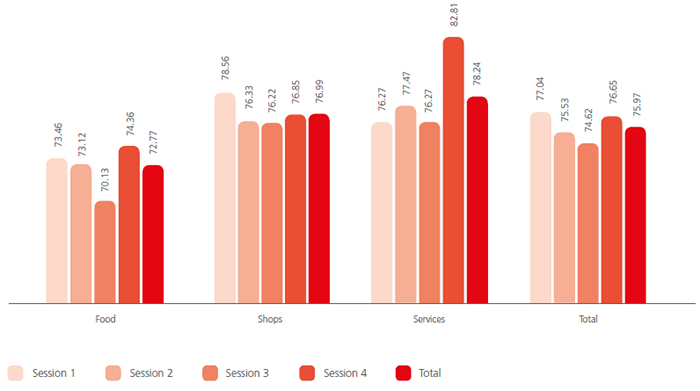
Looking at the data according to business type, it emerges that services and shops are above the general average (78.24 and 76.99), respectively), while food category (72.77) is lower than the general average (75.97), even though it improved compared to the 2014 figure (75.87).
Mystery Shopping - Average perceived quality by type of business (scale 1-100)
Source: SEA
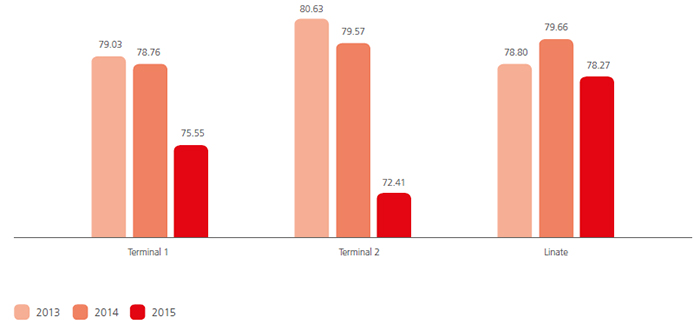
Observing the average value of perceived quality in the 2013-2015 three-year period, there is a more marked decrease for Malpensa airport, while decrease is less pronounced for Linate airport.
Mystery Shopping - Average perceived quality by airport (scale 1-100)
Source: SEA
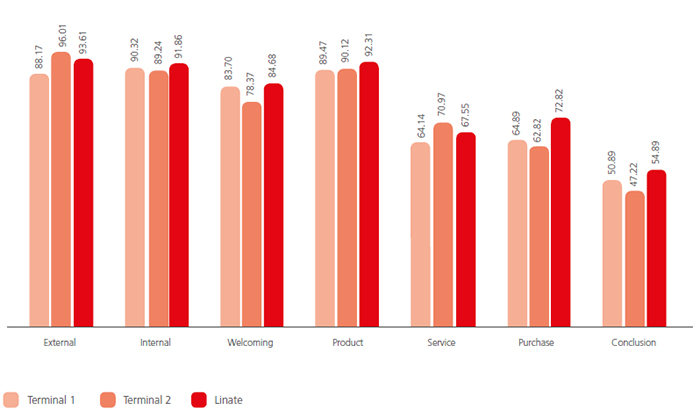
Mystery Shopping - Drivers of perceived quality by airport (scale 1-100)
Source: SEA
Compared to 2014, 2015 Mystery Shopping survey shows a drop of over 3 percentage points on all three categories (food, shops and services). Analysing the results from the point of view of airports, Terminal 1 shows a drop of about 3 percentage points, while the drop at Terminal 2 (-7.1) is sharper, and for Linate the decrease is very small (-1.4). Shopping experience highlights a good result for facilities and products, while results are lower on issues such as service, purchase, and conclusion of the sale.